 5:46
5:46G25 coordinates & nMonte modelling
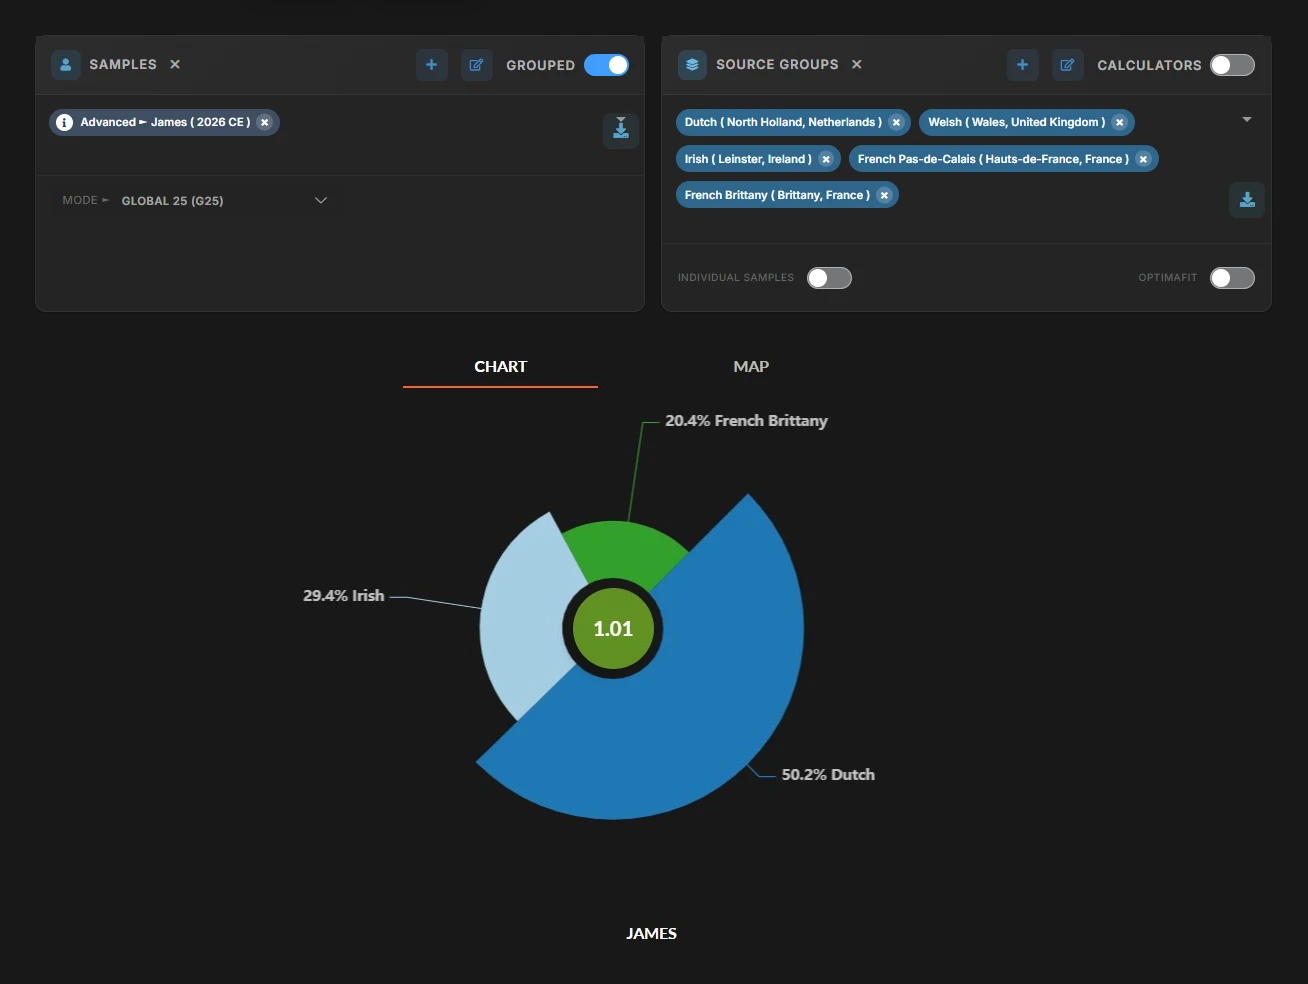
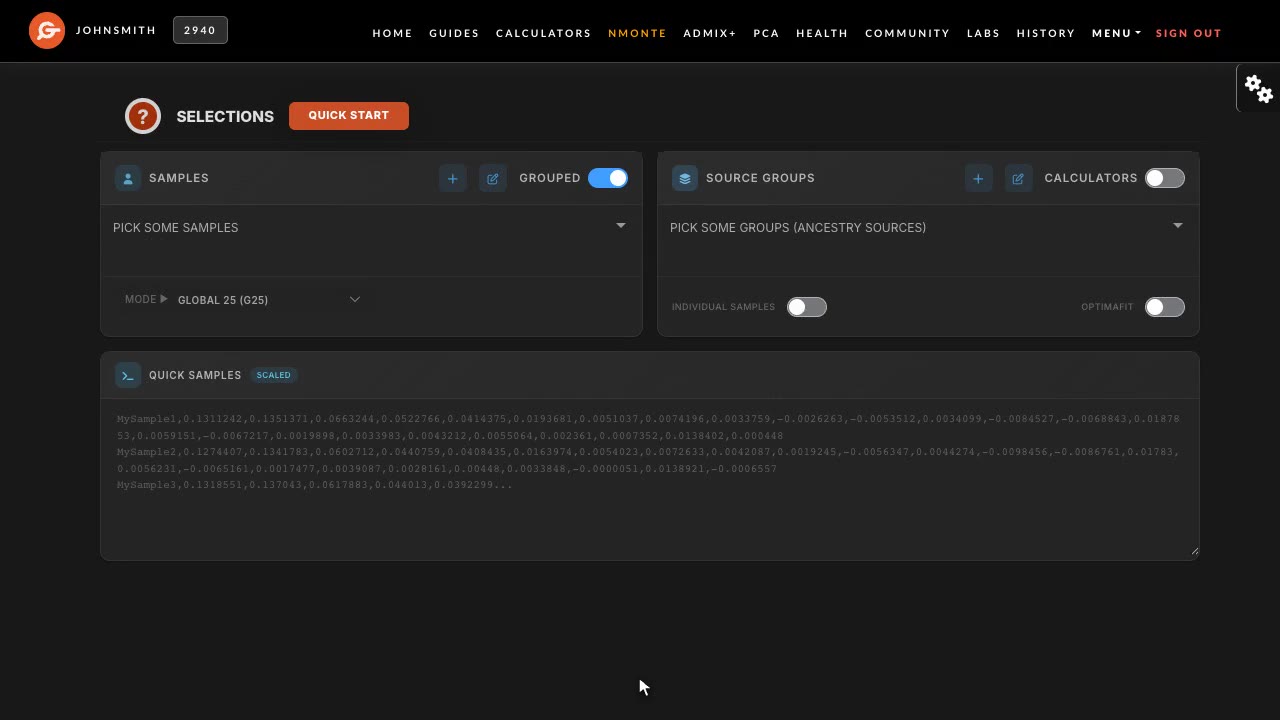
Get Global 25 coordinates for your own DNA for free, then model your ancestry with nMonte as a mixture of reference populations and read what the fit distance means.
Upload your raw DNA file from 23andMe, AncestryDNA, FTDNA, or MyHeritage.
Reveal your full genome with whole-genome imputation and run 500+ free admixture calculators.
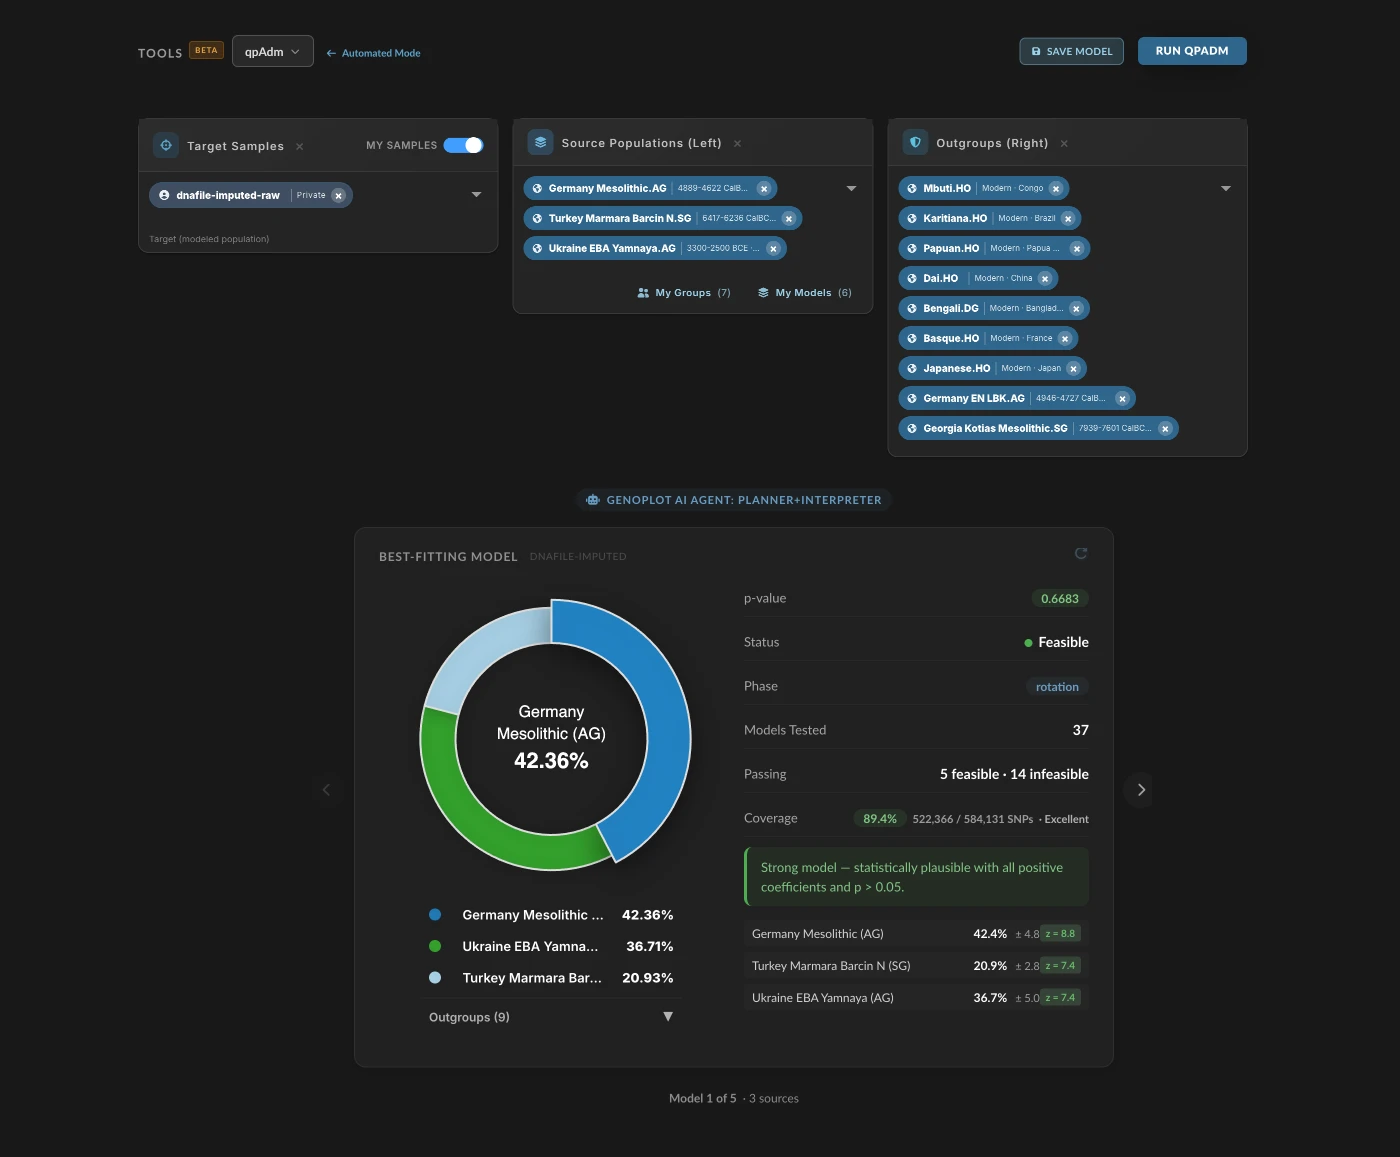
Unlock academic-grade qpAdm and f‑statistics.
From admixture breakdowns and principal component analysis to DNA-linked family trees and a daily health dashboard, our suite of tools gives you the deepest possible view into your genetic heritage.
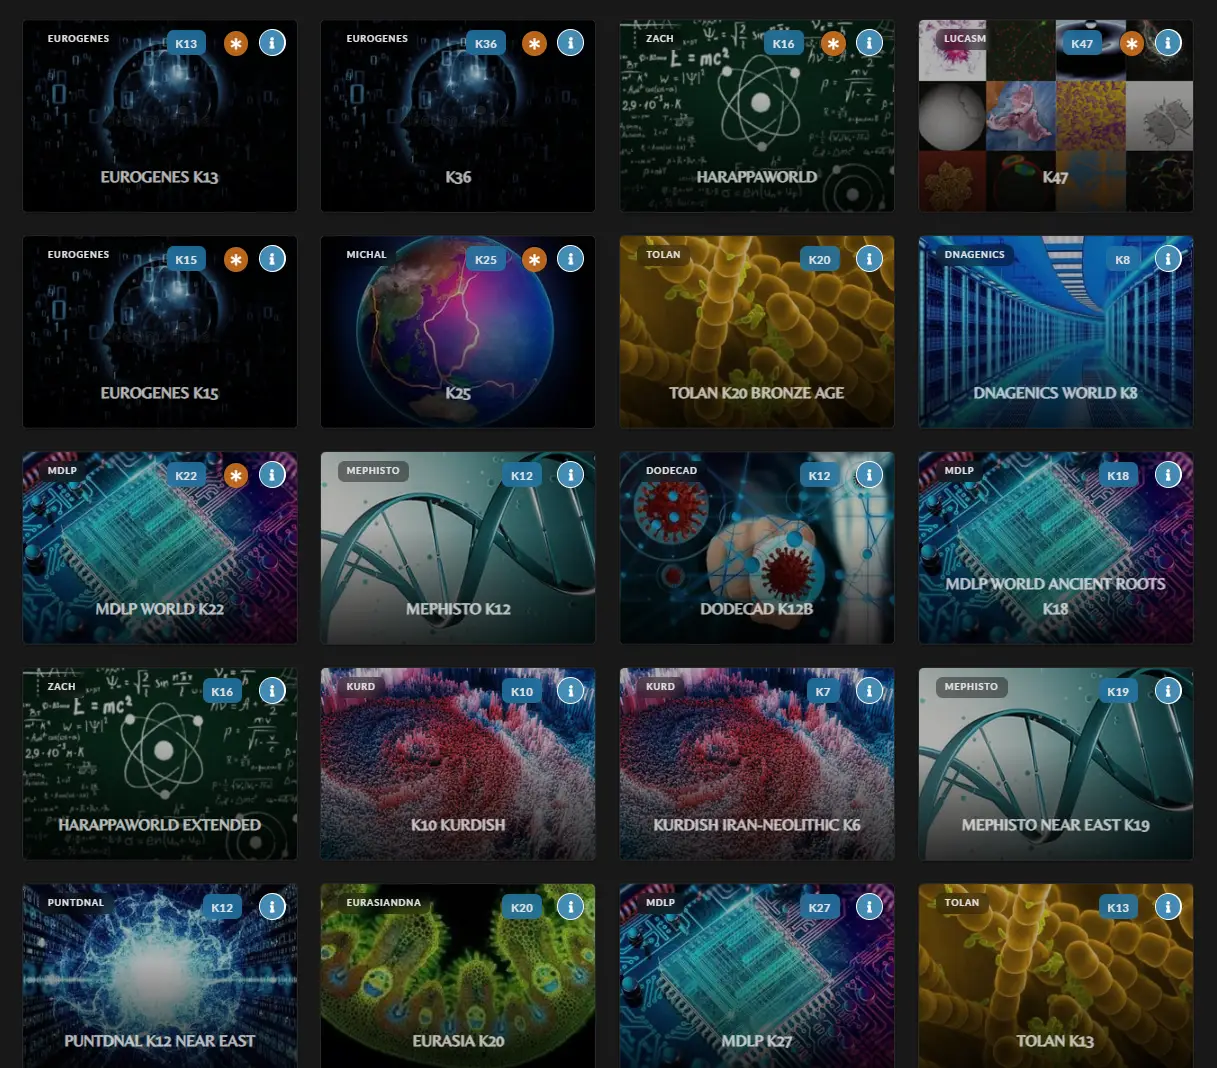
Hundreds of ancestry calculators offering nuanced views into recent and ancient ancestral sources from projects like Eurogenes, MDLP, and HarappaWorld.
nMonte runner for granular ancestry modeling. Mix and match ancestral sources to create custom models and share your own calculators.
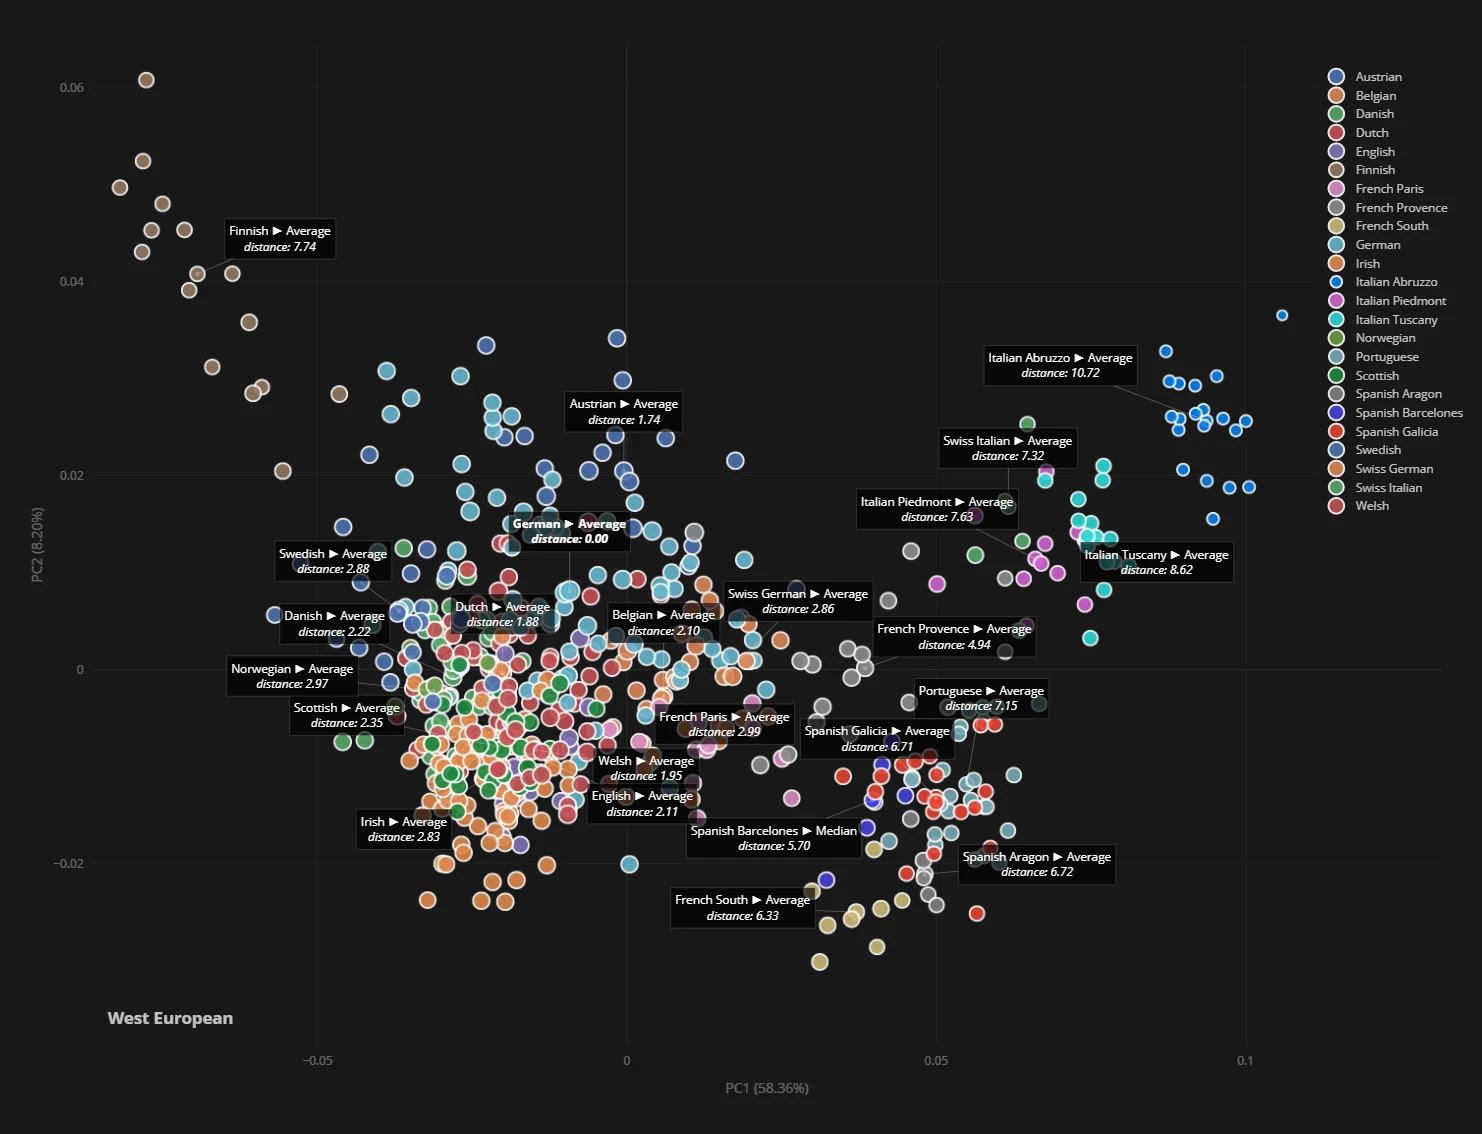
Visualize your autosomal genetics relative to regional and global populations on interactive 2D and 3D Principal Component Analysis charts.
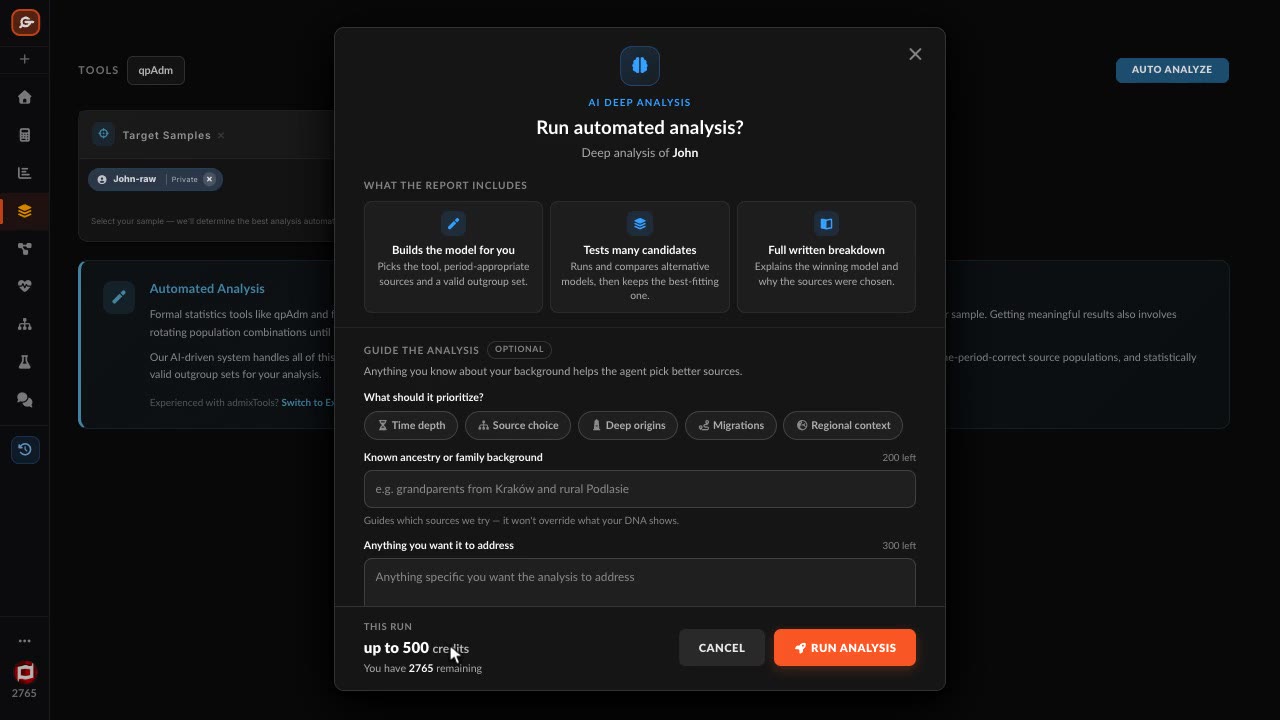
Academic-grade qpAdm, qpWave, and f-statistics — the toolkit used in peer-reviewed paleogenetics — with AI-assisted population selection for everyone.
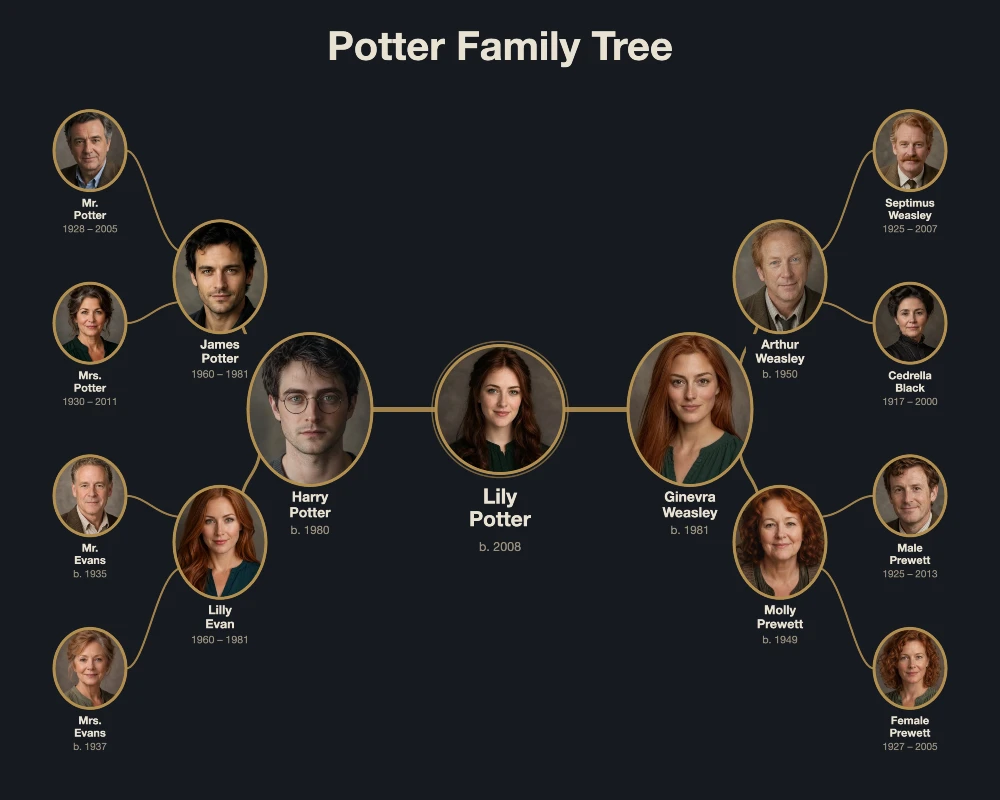
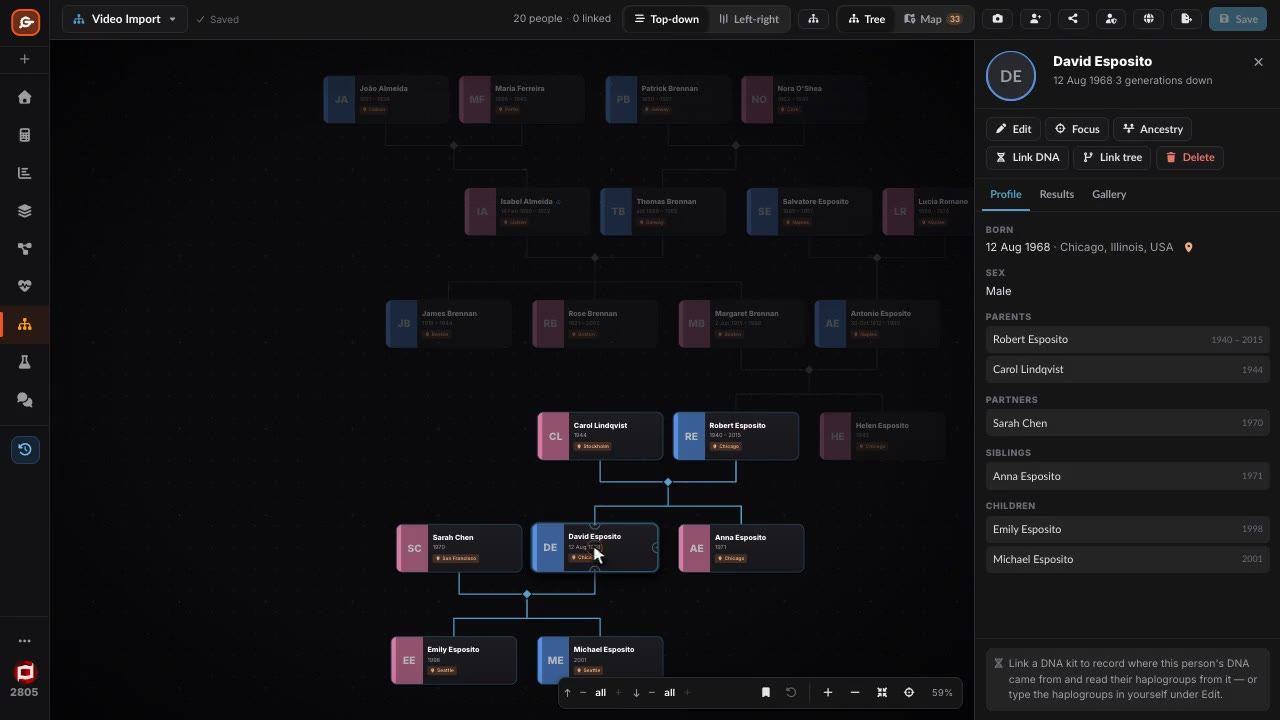
An interactive pedigree wired into your DNA — link a person to a raw kit and their haplogroups fill in by themselves, attach admixture and qpAdm results, and see four generations of migration on a world map.
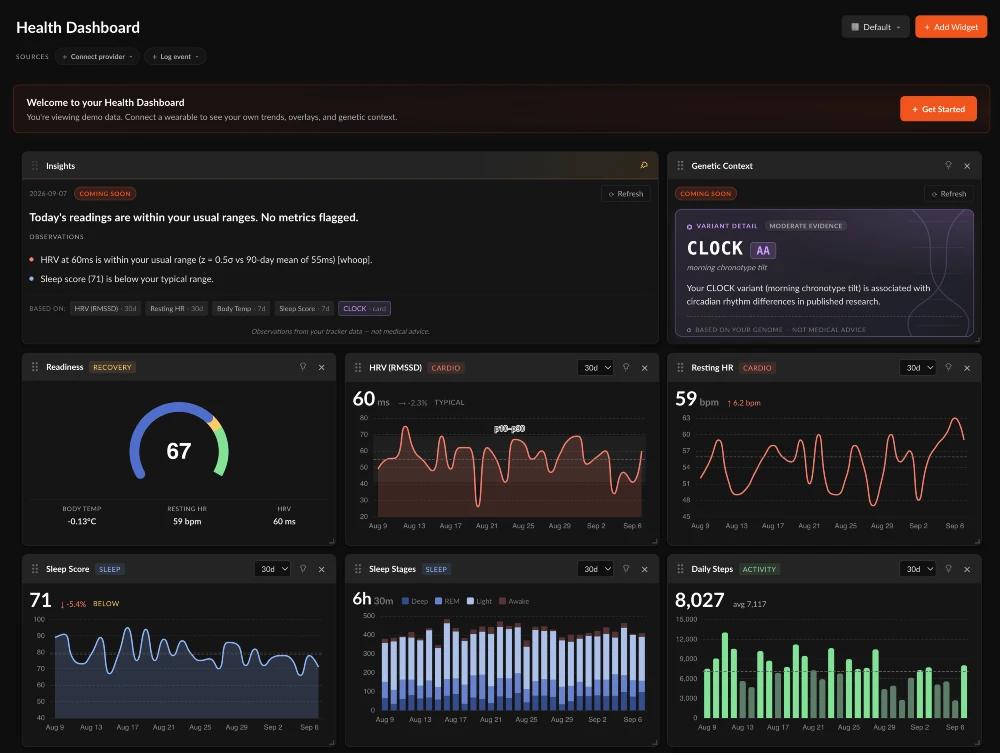
The rest of Genoplot reads a genome that never changes. Health reads the parts of you that change daily — HRV, resting heart rate, sleep and readiness from your Oura ring or Whoop strap, measured against your own baseline.
For years, formal statistics like qpAdm and f-statistics were the preserve of academic labs running AdmixTools on HPC clusters. Admix+ brings that same toolkit — the one behind peer-reviewed paleogenetics papers in Nature and Science — to your consumer DNA upload.
Consumer DNA chips read only 0.7% of your genome. Whole-genome imputation fills in the rest using a statistical reference panel — turning your typed markers into a near-complete picture.
All 22 autosomes — drops straight into any tool that reads VCF, with calibrated per-tier accuracy reported alongside.
Your genotypes projected onto the Allen Ancient DNA Resource v66 panel — instantly compatible with qpAdm, f3, f4, qpWave and the public ancient-DNA dataset.
A single pre-formatted file that drops into every legacy admixture calculator — no manual conversion, provides > 90% coverage.
Per-tier concordance vs WGS, per-chromosome runtime, MAF-stratified accuracy — full transparency on imputation quality.
Upload your raw file from 23andMe, AncestryDNA, FTDNA, MyHeritage, or LivingDNA.
Pick from 500+ admixture calculators, or run an nMonte simulation with your own source populations.
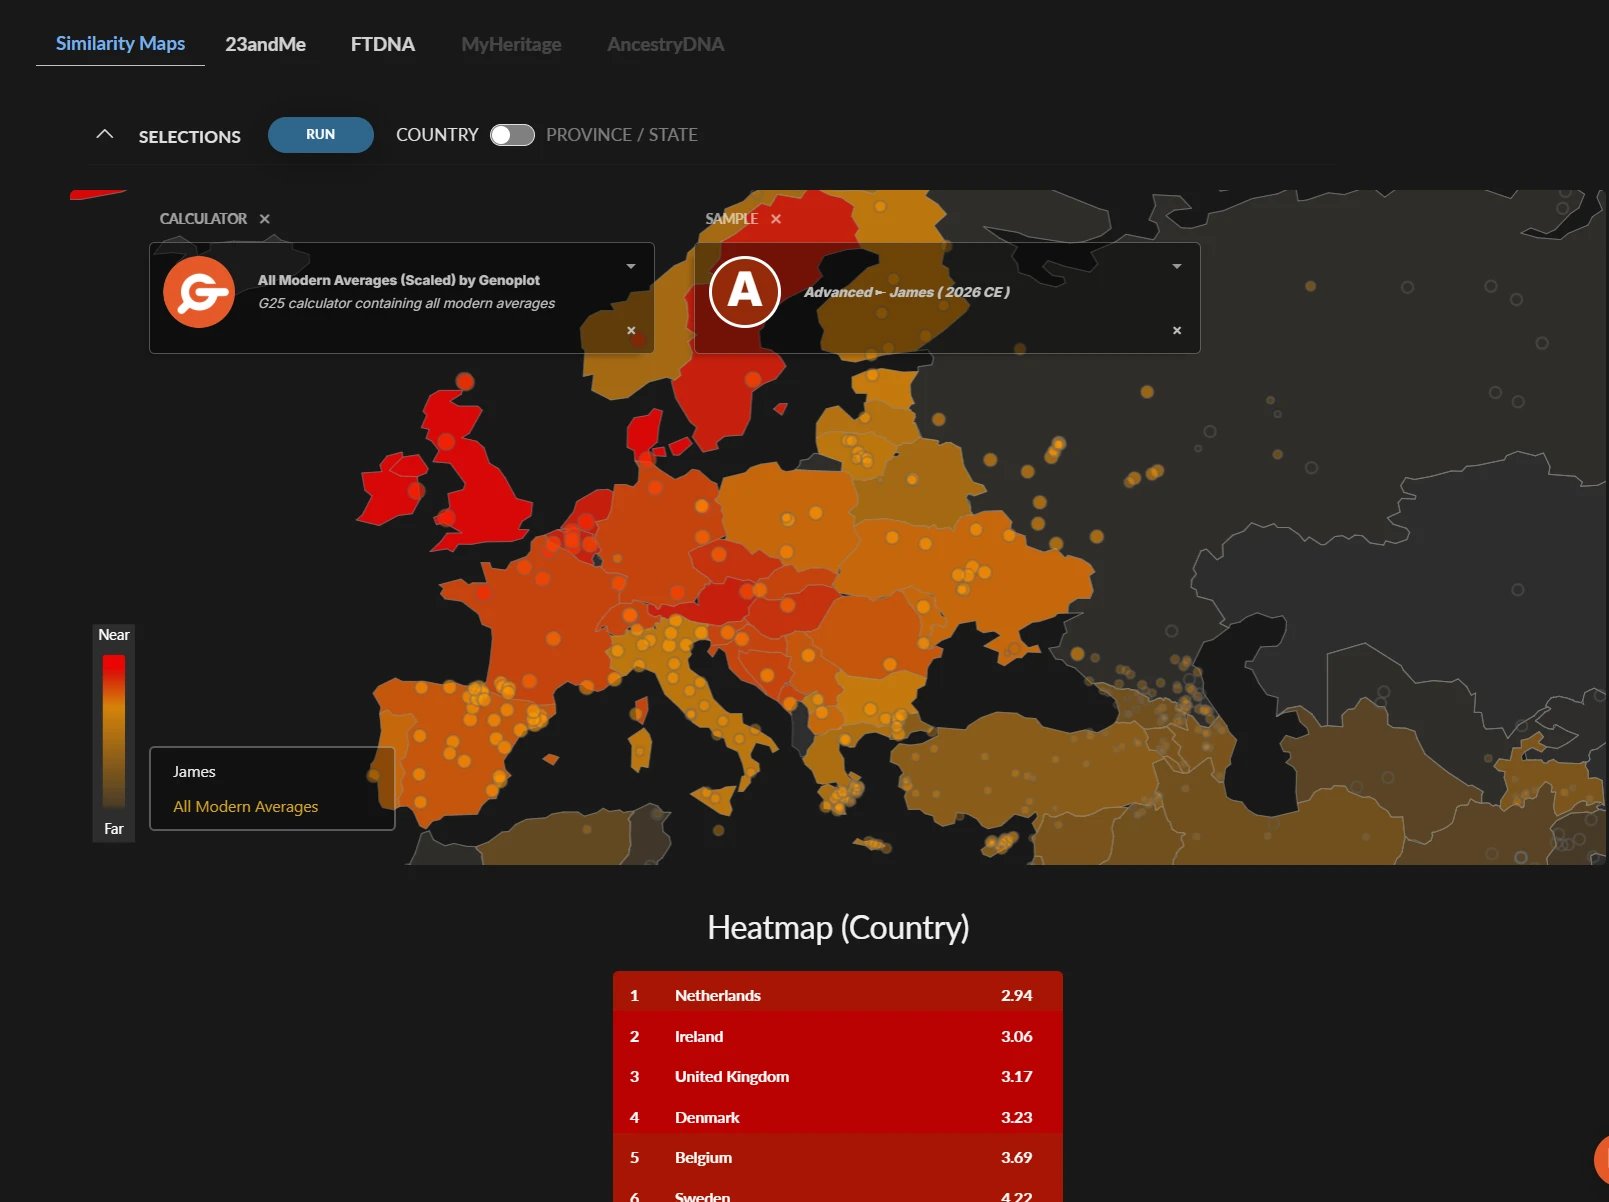
View breakdowns, similarity maps, PCA plots, and share your results with the community.
Every tool on Genoplot comes with a step-by-step written guide, screenshots included, and a short captioned video. Start with G25, qpAdm and family trees, then work through the rest.
5:46Get Global 25 coordinates for your own DNA for free, then model your ancestry with nMonte as a mixture of reference populations and read what the fit distance means.
 4:06
4:06Formal admixture testing with the AdmixTools methods behind published paleogenetics: build a qpAdm model from sources and outgroups, run it, and read the p-value, the admixture weights and the diagnostics.
 3:40
3:40Build or import a GEDCOM family tree, link people to your raw DNA kits so their haplogroups fill in by themselves, attach admixture and qpAdm results, and map four generations of migration.
Join thousands of users who have discovered deeper insights into their genetic heritage.
Create Your Free Account →Genoplot is a consumer genomics platform whose primary purpose is to ensure that leading-edge ancestry and genetics technology is freely available to the personal genomics community. We provide a broad variety of consumer and hobbyist tools for personal genomics and ancestry exploration