 3:34
PCA Plots
Step-by-step guide to PCA plots on Genoplot: loading a preset, adding your own sample, choosing a reference, and reading the distances.
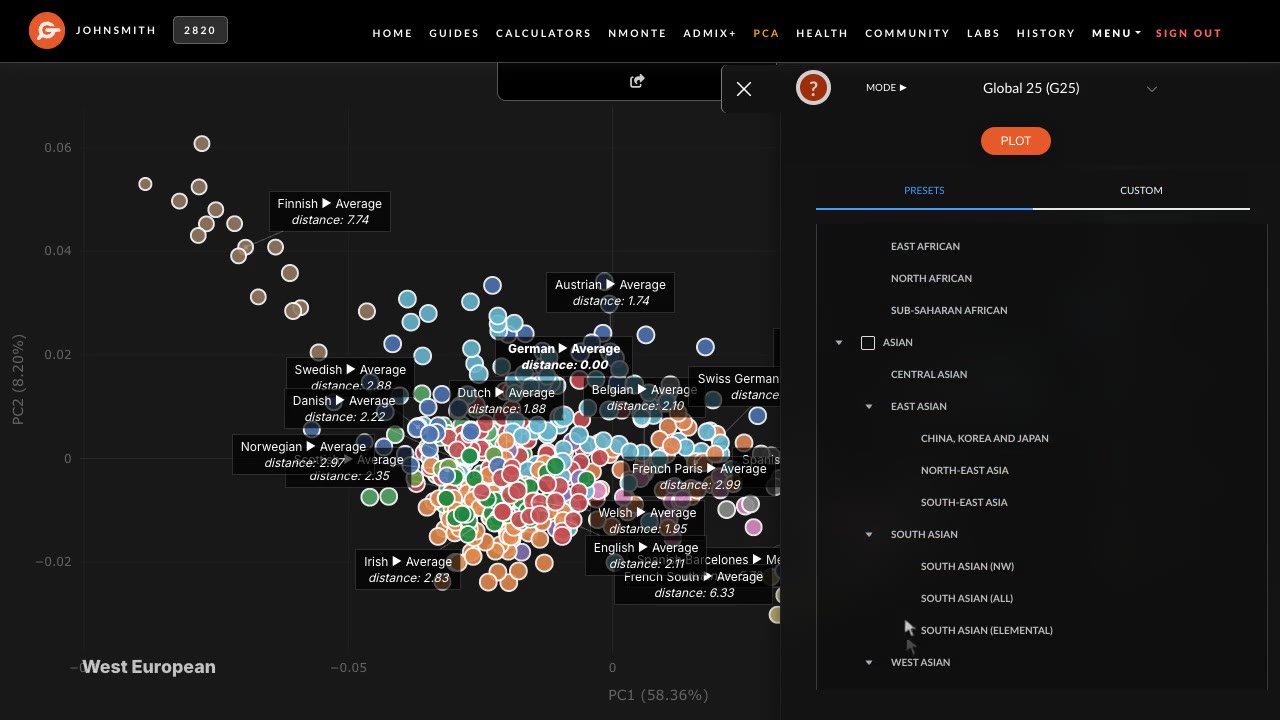
Place your own sample on an interactive principal component chart beside ancient and modern reference populations. Start from a regional preset, rotate it in 3D, find the populations nearest to you, and hand a cluster straight to nMonte.
Regional plots for Europe, West, South, Central and East Asia, and Africa, ready in a click, with room for your own sample.
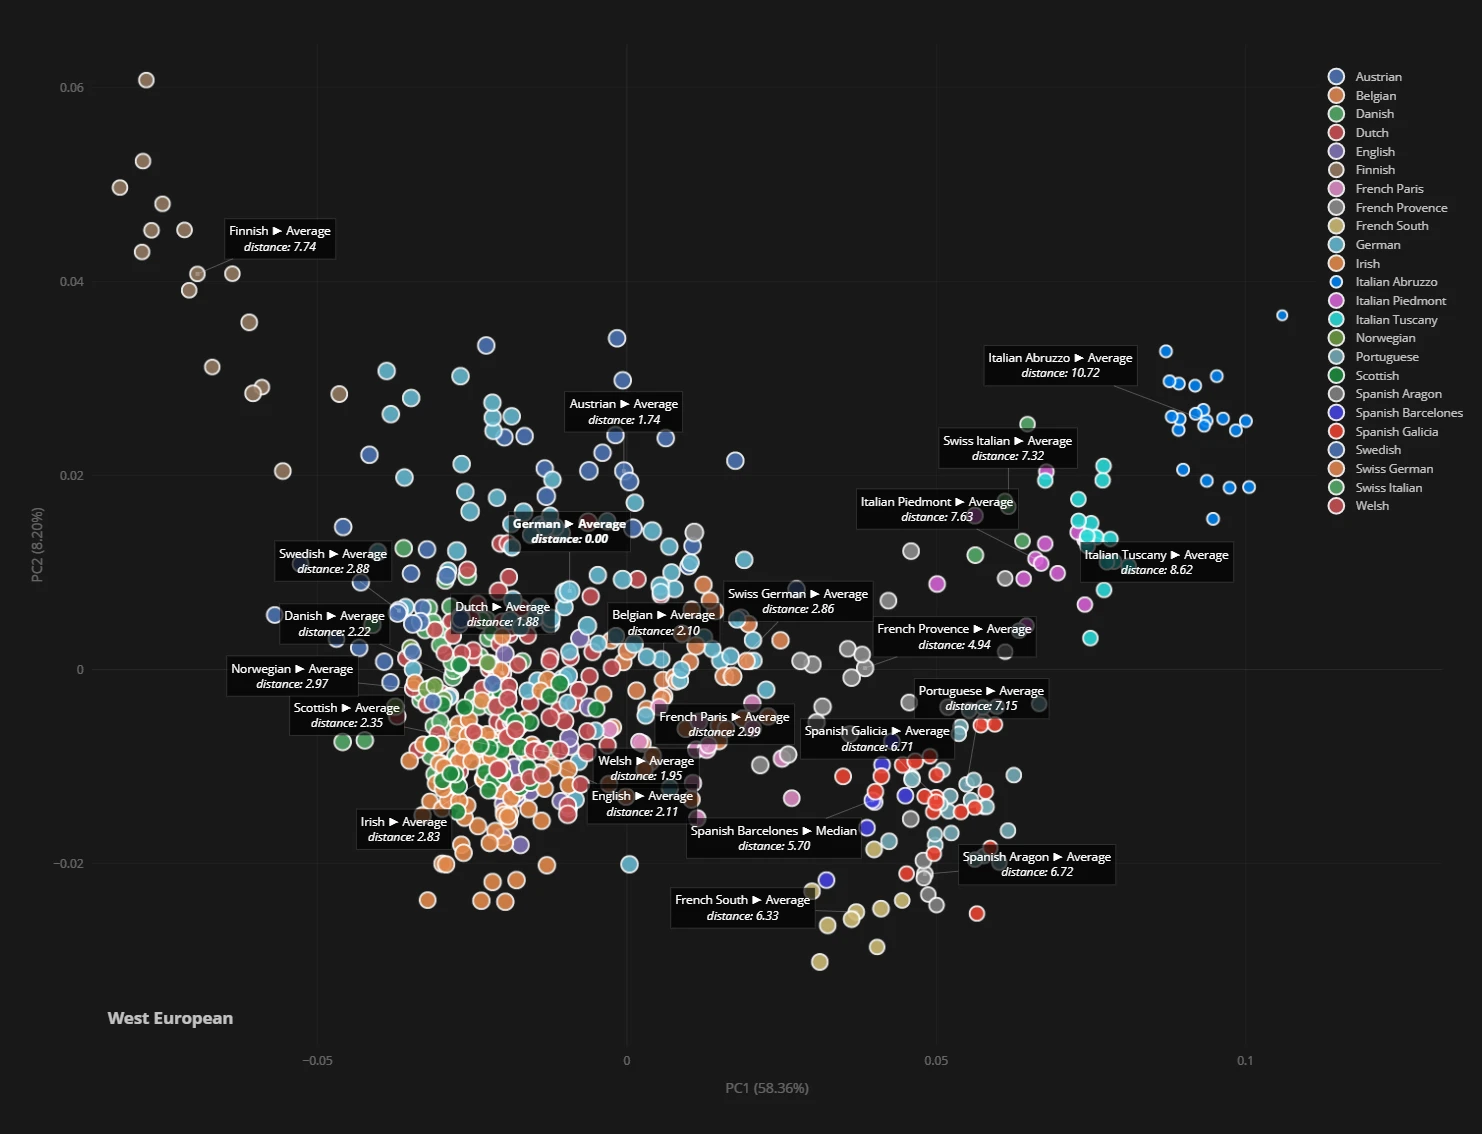
Add your sample once it has G25 coordinates and see where you fall, how far you are from any reference, and which populations sort closest.
Group the plot with k-means or Ward clustering, outline each cluster, and list the populations and samples nearest to yours.
Lasso part of the plot or pick a cluster and send it to nMonte as source populations, or save a cluster’s centre as a sample.
Rotate the plot in 3D, choose which principal components sit on each axis, and export the chart as SVG or PNG.
With a plan’s credits, ask the AI agent what the clusters represent, where your samples sit and what to model next, then ask follow-up questions.
Add the raw file from 23andMe, AncestryDNA, FamilyTreeDNA, MyHeritage, LivingDNA or WeGene, exactly as you downloaded it.
Run a G25-ready calculator such as Eurogenes K15; the coordinates come with the run.
Open a preset or build your own, add your sample, and read the distances.
Each opens a ready-made Global 25 plot that you can add your own sample to.
Principal component analysis compresses genetic variation into a few axes, so populations that are genetically close sit close together. It is the quickest way to see where you fall among reference groups.
Plotting, adding your sample, saving and sharing are free. The AI analysis uses more Compute Credits than the free monthly allowance, so it needs a Basic or Pro plan.
A sample needs coordinates first. Running a G25-ready calculator such as Eurogenes K15 gives you simulated G25 coordinates at no extra cost, and HarappaWorld, Eurogenes and Dodecad results can be plotted in their own spaces.
Up to 100 reference groups and 500 of your own samples, drawn from thousands of ancient and modern populations.
Create a free account, upload your raw DNA, and see where you fall.